Browse all products
943 products
We are Pediment Publishing, publishers of premium books, posters, and other collectibles since 1997. Browse products by a partner or tag, and sort using the filters below. You can also check out our various product collections in history, sports, wall art, or puzzles. Looking for something specific? Try searching across our thousands of products.
-

Capture Minnesota: Volume IV
$35.95
$39.95 -

Arkansas in Seasons: A Photographic Journey Through Arkansas
$39.95
-
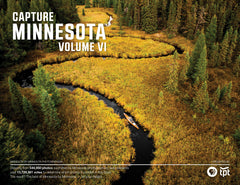
Capture Minnesota VI
$39.95
-

Minnesota in Seasons: A Photographic Journey Through Minnesota
$39.95
-

Capture Wisconsin II: Wisconsin Through the Eyes of Wisconsin Photographers
$27.95
-

Capture Arkansas IV: The best of Arkansas in Photography
$31.95
$39.95 -

Capture Door County: Seasons Behind the Door: A Photographic Look at Door County's Seasons
$31.95
$39.95 -
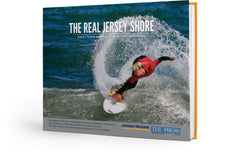
The Real Jersey Shore: Jersey Shore by Jersey Shore Photographers
$31.95
$39.95 -

Capture Door County: The Best of Door County in Photography
$27.95
$39.95 -

Capture Arkansas III: The Best of Arkansas in Photography
$35.95
$39.95 -
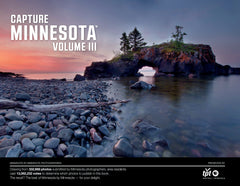
Capture Minnesota: Volume III
$39.95
-
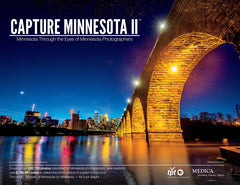
Capture Minnesota II: Minnesota Through the Eyes of Minnesota Photographers
$39.95


millions of happy customers

I am so glad to have discovered Pediment Publishing! The service is excellent, and the quality of the three orders I received is the very best!
Sylvia M.
Verified Customer
Communication on when my order would be delivered was very informative and accurate. Item was delivered as promised and in excellent condition.
David W.
Verified Customer
Purchased as a gift for my husband. He danced all over the place he was so excited. Everything was just gorgeous in the book. Also fast shipping.
Betty R.
Verified Customer
The books are fantastic quality and almost make you feel like you were at the games. I would buy from and recommend Pediment Publishing!
Steven A.
Verified Customer
Great communication. I ordered as a part of a pre-sale and Pediment did an outstanding job on communicating when/where our order was.
Patti A.
Verified Customer
Want to read even more reviews? We have more than 10,000 reviews from customers, verified by Judge.me, a third party.
Shop by collection


Why shop here?
We are Pediment Publishing, an independent publisher of premium books and other collectable products. We've been wowing millions of customers for more than 25 years, which is why our customers give us such great reviews on Judge.me, an independent review platform. We are also rated A+ by the Better Business Bureau. Here are a few ways we promise to wow you!
Customers love us
★★★★★I am so glad to have discovered Pediment Publishing! Service is excellent and the quality of the three books I received is the very best. I'll continue to order from this fantastic organization!
★★★★★Purchased as a gift for my husband. He danced all over the place he was so excited. Everything was just gorgeous in the book. Also fast shipping. Thank you!
★★★★★Excellent quality and great communication. I ordered as a part of a pre-order promotion and Pediment Publishing did an outstanding job on communicating when/where our order was. Well packaged for shipment and tracked the order thru to delivery. Highly recommend Pediment for any orders going forward and we shall be return customers. Many thanks!
★★★★★The books are fantastic quality and almost make you feel like you were at the games. I had a fulfillment issue and Pediment replaced my copy right away. You really learn the truth about companies when something goes wrong, and after my experience, I would buy from and recommend Pediment Publishing as an online bookstore of choice!
★★★★★Communication on when my order would be delivered was very informative and accurate. Item was delivered as promised and in excellent condition.
★★★★★Easy to order; shipped and received very quickly. Packaging was excellent; book covered in plastic for protection. Just as described. I think my gift recipient will love it!